Data Utility Assessment
Measure the performance of synthetic data in machine learning tasks to determine if it can effectively replace original data.
Choosing the Right Task Type
The choice of utility evaluation task depends on:
Data Characteristics
- All numerical features: Best suited for regression or clustering tasks
- Mix of categorical and numerical: Suitable for any task type
- Target variable present: Classification or regression tasks
- No target variable: Clustering tasks only
Domain Knowledge
Consider your data’s intended use case:
- Predictive modeling: Choose classification or regression based on target type
- Pattern discovery: Consider clustering for exploratory analysis
- Risk assessment: Classification tasks often provide clearest insights
Evaluation Strategy
While our example dataset can support all three task types, you only need to select one task that best represents your data’s utility. Choose the task most relevant to your actual use case.
Common Parameters
All utility evaluations share these base parameters:
| Parameter | Type | Default | Description |
|---|---|---|---|
| method | string | Required | Fixed value: mlutility |
| task_type | string | Required | Task type: classification, regression, or clustering |
| experiment_design | string | domain_transfer | Experiment design: domain_transfer or dual_model_control |
| random_state | integer | 42 | Random seed for reproducibility |
Experiment Design Strategies
The experiment_design parameter determines how models are trained and evaluated to assess synthetic data utility.
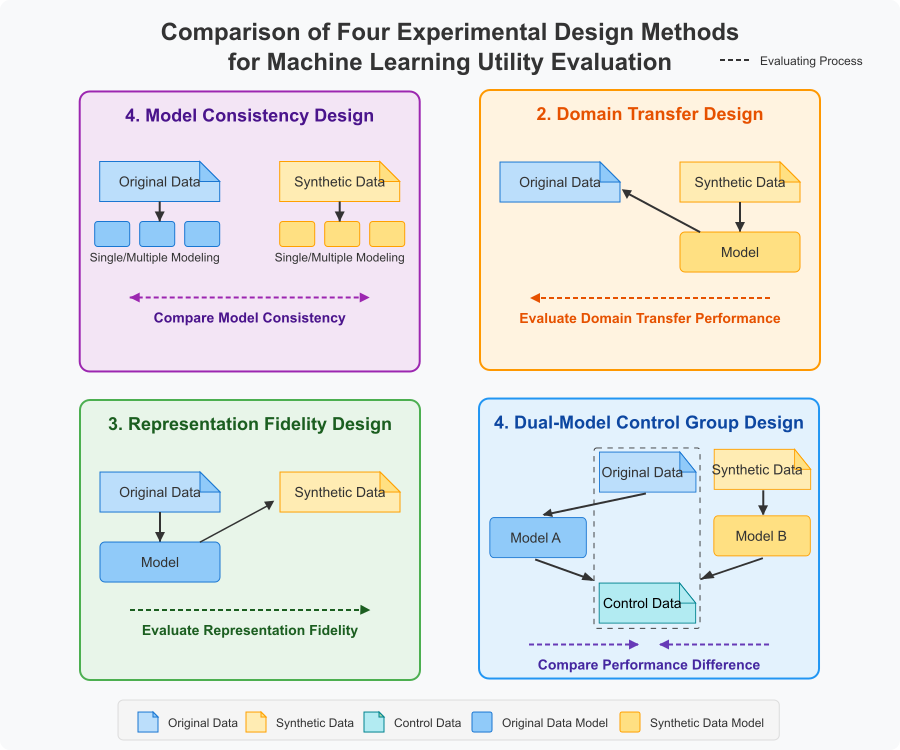
Domain Transfer (Default)
Question: “Does synthetic data capture the essential patterns that generalize to real data?”
- Implementation: Train on synthetic data, test on original data
- Use Case: Model development before accessing real data
- Interpretation: High performance indicates strong pattern preservation
- Why Default: Aligns with NIST SP 800-188 guidelines for synthetic data validation
Dual Model Control
Question: “Can synthetic data achieve comparable model performance to original data?”
- Implementation: Train separate models on original and synthetic data, test both on control dataset
- Use Case: Validating synthetic data as a replacement for original data
- Interpretation: Small performance gap (< 10%) indicates high utility
Model Consistency (Not Supported)
Question: “Does synthetic data lead to the same model selection decisions?”
- Implementation: Compare model rankings using rank correlation
- Use Case: AutoML and hyperparameter optimization scenarios
- Interpretation: High correlation (> 0.7) enables reliable model selection
Representation Fidelity (Not Supported)
Question: “How well does synthetic data match the learned distribution?”
- Implementation: Train on original data, test on synthetic data
- Use Case: Validating synthesis quality and distribution matching
- Interpretation: High performance suggests good distribution preservation
Result Evaluation Guidelines
By Experiment Design
Domain Transfer
- Use absolute metric values (e.g., ROC AUC > 0.8)
- Higher values indicate better generalization
Dual Model Control
- Focus on metric differences between models
- Smaller differences (< 10%) indicate better utility
Model Consistency (When Available)
- Evaluate rank correlation coefficients
- Values > 0.7 indicate strong consistency
Setting Acceptance Criteria
- Pre-define Standards: Establish clear criteria before evaluation
- Industry Collaboration: Consider domain-specific requirements
- Task Prioritization: Classification tasks often provide clearest insights
- Multi-metric Aggregation: Use weighted averages when multiple metrics needed
Imbalanced Data Handling
ROC AUC Limitations
In highly imbalanced datasets, ROC AUC can produce misleadingly optimistic results:
Example: Fraud detection with ~3-4% positive rate
- ROC AUC: 0.86-0.90 (appears excellent)
- Sensitivity: 0.54-0.56 (nearly half of fraud cases missed)
Comprehensive Evaluation Strategy
Primary Metric: MCC
- Considers all confusion matrix elements
- Robust for imbalanced datasets
Secondary Metric: PR AUC
- Focuses on positive class quality
- Use when minority class < 10%
Resampling Methods
- SMOTE-ENN: For noisy data with unclear boundaries
- SMOTE-Tomek: For cleaner data with overlapping classes
References
NIST SP 800-188. (2023). De-Identifying Government Data Sets. Section 4.4.5 “Synthetic Data with Validation”
Davis, J., & Goadrich, M. (2006). The relationship between precision-recall and ROC curves. Proceedings of the 23rd International Conference on Machine Learning, 233-240. https://doi.org/10.1145/1143844.1143874
Chicco, D., & Jurman, G. (2020). The advantages of the Matthews correlation coefficient (MCC) over F1 score and accuracy in binary classification evaluation. BMC Genomics, 21(1), Article 6. https://doi.org/10.1186/s12864-019-6413-7
Saito, T., & Rehmsmeier, M. (2015). The precision-recall plot is more informative than the ROC plot when evaluating binary classifiers on imbalanced datasets. PLOS ONE, 10(3), e0118432. https://doi.org/10.1371/journal.pone.0118432